← Back to portfolio

AE8900 · data quality · machine learning · model interpretation

When 45% of a simulation study silently produces nothing.

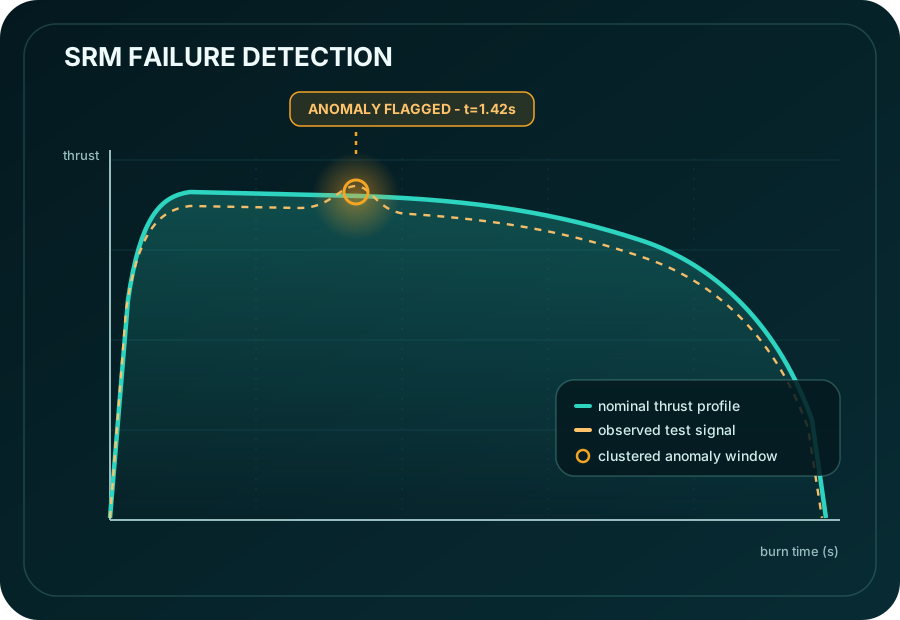
A large design-of-experiments study of solid rocket motor geometries returned no output at all for 6,804 of 15,120 cases — no metrics, no burn history, and no error message. This project asks whether those silent failures are random accidents or something predictable, and traces them from statistical structure down to the line of code that causes them.

Thrust time-series and failure screening illustration

Research question

Are missing-output cases randomly distributed across the design space, or are they structured by geometry inputs — and can a pre-check identify high-risk cases before simulation time is spent on them?

Data and methods

The primary dataset is a full-factorial sweep of 15,120 Finocyl grain geometries across five inputs. Output completeness served as a proxy failure label, validated at the file level against the burn-history archive: files exist for 8,315 of 8,316 completed cases and for none of the 6,804 flagged cases, ruling out partial post-processing loss. Three classifiers of increasing capacity — logistic regression, a depth-four decision tree, and a 300-tree random forest — were compared in scikit-learn using stratified five-fold cross-validation.

A leakage trap worth naming

Failure turned out to be fully deterministic in four of the five inputs, so each unique geometry appeared nine times with an identical label. Under a naive random train/test split, a random forest scored 99.8% accuracy — almost entirely by memorizing duplicate geometries. Collapsing the data to its 1,680 unique combinations and evaluating only on geometries never seen in training brought the honest figure to 96.8% accuracy (AUC 0.986). The gap between those two numbers is the point: the more impressive result was the wrong one.

Two orthogonal failure modes

Feature importances place fin ratio (39.6%) and fin count (30.7%) at the center of hard failures, with the finocyl ratio contributing almost nothing (1.5%) — it has exactly a 45.0% failure rate at every one of its nine levels. A second screen for completed cases falling short of their target operating pressure flagged 14.4% of successful runs, and there the finocyl ratio dominates (47.0% importance). The input irrelevant to whether a case runs at all governs whether it reaches design pressure.

From statistics to mechanism

Statistical structure alone does not explain why a solver goes silent. Inspection of the source found a chamber-pressure balance loop whose iteration counter is incremented but never checked — no cap, no break, no exception. A case whose pressure guess oscillates without meeting tolerance loops indefinitely until the process is killed externally, writing nothing. That single mechanism reproduces every observed property of the failures: the silence, the all-or-nothing missingness, and the determinism. A corrective patch converts them into explicit, diagnosable errors.

What it does not settle

The patch has been verified on a nominal motor but not yet executed on one of the original failing cases, which remains the definitive confirmation. The empirical fin-count–fin-ratio boundary is reported as an observation rather than a derived physical rule. And roughly 1,080 of the flagged cases change label depending on the smoothing configuration of the post-processing pipeline, so part of the label reflects curve-quality screening rather than solver failure.

Why this matters beyond rocket motors

The transferable lesson is about trusting data before modeling it. Silent failures, deterministic structure masquerading as sample size, and evaluation leakage are hazards in any large simulated or observational dataset — and the 99.8% figure a naive split produced here is exactly the kind of number that survives review because it looks good. Screening the data, and then explaining the screen mechanically rather than statistically, is the habit this project taught me.