Current research question
How do targeted road-network disruptions change shortest-path travel time, reachability, and threshold-based accessibility across a defined Atlanta study area?
independent · graph analytics · mobility resilience · accessibility
This project started as a road-network resilience prototype. It now adds a schedule-based MARTA accessibility track using public GTFS data, 50 Census tract centroids, and 101 mapped essential facilities. It is still not a calibrated traffic assignment model, a real-time transit tool, or an equity outcome study.
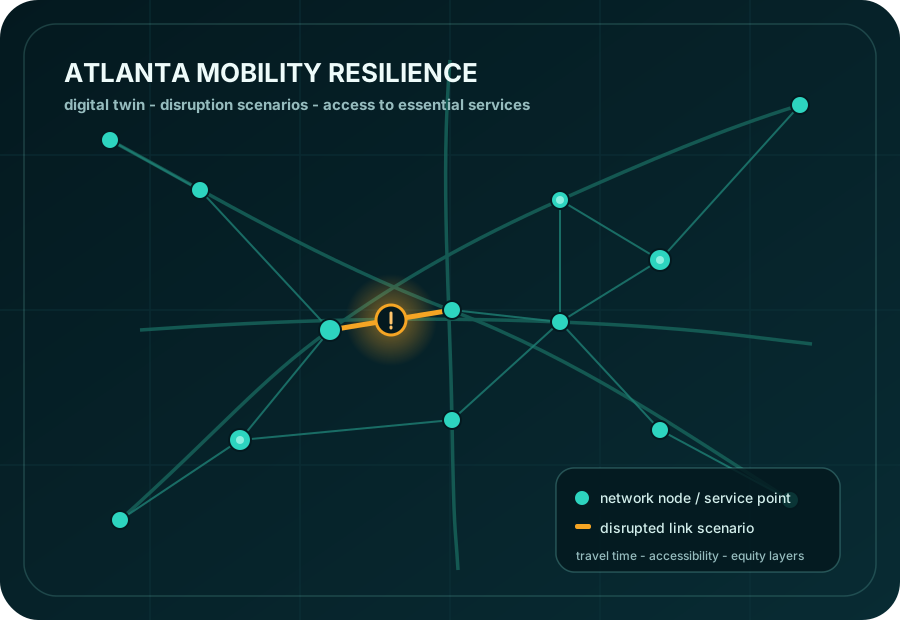
How do targeted road-network disruptions change shortest-path travel time, reachability, and threshold-based accessibility across a defined Atlanta study area?
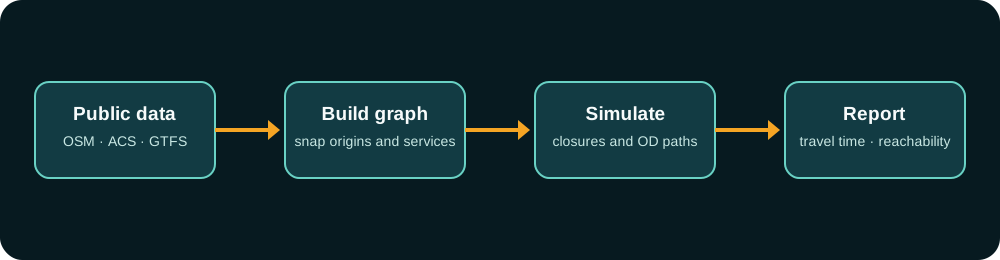
The pipeline downloads and caches a drivable OpenStreetMap network, assigns speed and travel-time attributes, snaps configured origins and destinations to the graph, computes baseline OD travel times, then removes either random road edges or high-betweenness edges and recomputes accessibility. A run manifest now hashes the OSM graph, configuration, and result tables.
The frozen downtown demo used an OSM graph with 672 nodes and 1,641 directed edges. Removing the selected high-betweenness links increased mean travel time across nine illustrative OD pairs by 0.103 minutes; the random three-edge closure did not change those paths. Reachability and the toy opportunity count stayed unchanged.
The research config uses 50 Census tract representative points and 2024 ACS population and household-income estimates for Fulton and DeKalb counties. Those tracts represent an estimated 216,659 residents. A separate OpenStreetMap query found 101 currently mapped essential services within 10 km of downtown: 42 clinics, 35 fire stations, 14 hospitals, and 10 shelters.
ACS values are estimates, so the analysis keeps their margins of error. A deterministic Monte Carlo step carries population uncertainty through each accessibility scenario and reports a mean with 5th and 95th percentiles.
A fixed 20-route MARTA Planner review established that the transit track needs a further independent validation cycle before its accessibility metrics can be interpreted publicly. The current schedule percentages are development outputs, not public findings. The planned routing and calibration work is intentionally not represented as complete on this page.
A tract representative point is not an observed trip start. OpenStreetMap coverage varies, and each facility currently counts once because capacity data is incomplete. The result uses a static schedule with a fixed walking rule, so it does not measure live delays, fares, capacity, or rider behavior.
The transit work has a separate planned solution and validation path. Until its independent review is completed, this case study will not claim schedule-based accessibility conclusions.
Today the project demonstrates reproducible graph construction, scenario simulation, shortest-path analysis, geospatial data handling, and careful scope control. Its ML extensions remain future work.